Chapter 7
Single Photon Energy Loss and Resolution
In order to compare the number of single photon events to an analytical
prediction for the single photon process, e+e-® n[`(n)]g, it is necessary to fully
understand the effects of the energy loss incurred by the photon due to the
coil.
Since the single photon energy spectrum at Ös » MZ0 falls off
sharply, an accurate representation of the correction for the energy loss and
resolution is essential.
To compare directly with the prediction for e+e-® n[`(n)]g, this analysis focuses on
understanding the energy loss, correcting for the loss, and selecting events
based on the corrected energy.
This chapter discusses the single photon energy loss and resolution in the
context of the single photon counting measurement presented in this thesis.
7.1 Single Photon Energy Loss and Resolution
Corrections for the energy loss, DEg, are determined from the Monte
Carlo simulation and checked for consistency using the single electron events.
Here, DEg is due primarily to energy losses in the coil and is
defined as DEg = Egcorr - Egraw.
The energy corrections are determined from the Monte Carlo simulation of
e+e-® n[`(n)]g by comparing the Monte Carlo energy, Egfour vec., where Egcorr = Egfour vec. to the
simulated energy observed in the detector, Egraw, where Egraw = Egobs. as
follows,
|
|
| | |
Egcorr-Egraw
=Egfour vec.-Egobs.
|
|
|
|
| (7.1) |
The average energy loss is taken as the mean of the Gaussian fit to the
difference in the Monte Carlo energy and the deposited energy, DEg,
for a given bin in |cos(qg)|.
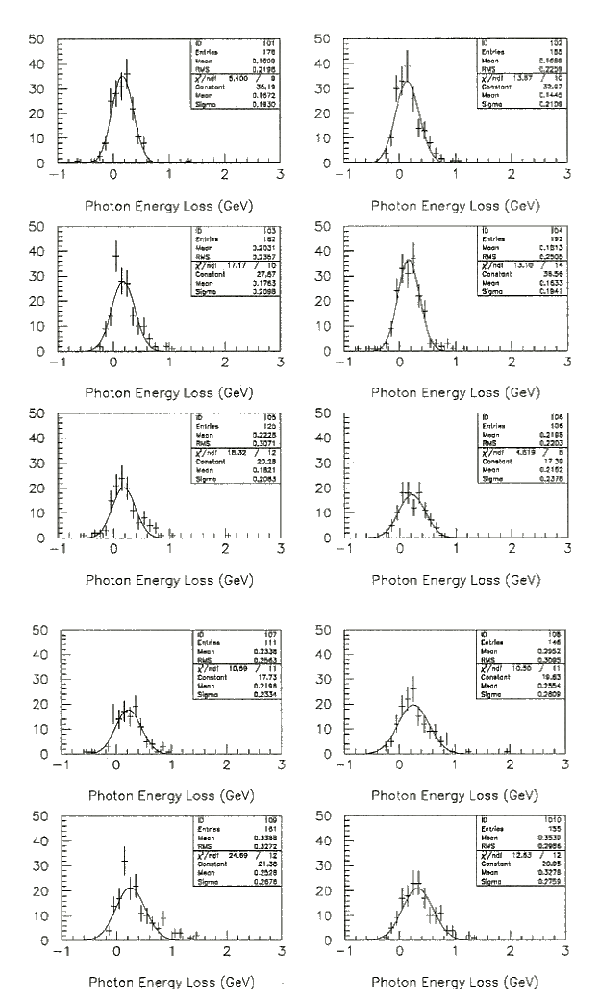
Examples of the fitted curves for the energy loss of the single photon Monte
Carlo is shown in Figure 7.1 for different bins in |cos(qg)|.
The statistical mean and standard deviation of the data points in each bin is
shown in the upper right hand corner of each of the fitted histograms.
The resolution is then defined as the standard deviation of the fit,
sDEg, for the given bin in |cos(qg)|.
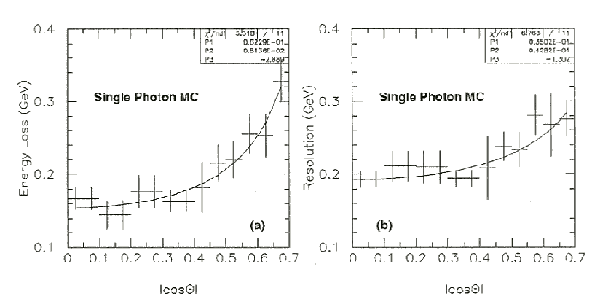
Figure 7.1: Energy Loss and Resolution of the Single Photon Monte Carlo
Fits to energy loss of the single photons Monte Carlo from the process,
e+e-® n[`(n)]g, are used to determine the average energy loss,
DEg
=Egcorr-Egraw
=Egfour vec.-Egobs. and the resolution of the
average energy loss, sDEg.
The angular bins for each of the fits are the same as those plotted in
Figure 7.2.
In Figure 7.2, the average energy loss and resolution points for
the single photon Monte Carlo determined from the fits shown in
Figure 7.1 are fit as a function of their expected dependence
on angle.
The form of the expected energy loss and resolution as a function of the angle
is
where
|
|
| | |
the first fit parameter determined to be 0.093840 |
|
| | |
the first fit parameter determined to be 0.001556 |
|
| | |
the first fit parameter determined to be -3.6930 |
|
|
|
|
The c2 of the energy loss fit is 5.52/11, while the c2 of the
energy resolution is 6.77/11, both well below 1.0.
The value of the energy loss used in the selection of the single photon events
is the value determined from the empirical equation of the fitted energy loss
points.
The average energy loss for the single photon Monte Carlo events is 0.196 GeV
and the average resolution is 0.219 GeV.
This indicates that an Egcorr cut at 1.75 GeV effectively accepts photons down
to 1.5 GeV for a corresponding cut on Eg directly, while an Egcorr cut at
1.75 GeV accepts photons down to 1.25 GeV.
This agrees well with the Monte Carlo single photon events for e+e-® n[`(n)]g which all
have Eg of at least 1.47 GeV for a cut on Egcorr at 1.75 GeVand all single
photon events for e+e-® n[`(n)]g which have an Eg of at least 1.28 GeV for a cut on
Egcorr at 1.5 GeV.
Figure 7.2: Single Photon Energy Loss and Resolution.
The difference between the photon Monte Carlo energy and the energy
deposited in the electromagnetic energy is due mainly to the energy loss
in the coil.
This energy loss given by Equation 7.1 is shown by the solid dots
with statistical errors in (a) along with the energy resolution in (b) over
photon polar angle with p < 5.0 GeV/c.
The energy resolution is defined as the standard deviation of the Gaussian fit
to the energy loss for the single photon events.
The points have been fitted with a third degree polynomial resulting in the
values shown.
7.2 The Single Electron Sample
A check of the consistency for the energy loss and resolution has been
performed using the single electron events.
These events are triggered by a superset of the same triggers for the single
photon events shown in Section 4.3 and occur abundantly in the
data.
The single electron events were selected from the data corresponding to periods
20 to 33 collected during the 1991 run of OPAL using the same selection
criteria as outlined in Section 6.1 with the following
important changes:
(1) The event must have at least one reconstructed central detector
track with 20 or more jet chamber hits and must have dE/dx > 9.0 keV/cm.
This cut removes much of the most important background to single electron
sample, the muon events.
(4) The event must have an electromagnetic cluster with deposited
energy, defined as the total energy in a 200 mrad half-angle cone centered on
the highest energy, greater than 1.0 GeV in the barrel region where
|cos(qe±)| < 0.7.
The single electron must also have a transverse momentum greater than
1.0 GeV/c.
These cuts select a clean sample of single electrons while reducing the
principle background to less than 1%.
The Monte Carlo programs used to generate the various physics processes have
already been discussed in Section 5.3.
The Monte Carlo generators used include: TEEGG [68] for the
e+e-® e+e-g process and VERMAS [76] for the e+e-® e+e-e+e-, the e+e-® e+e-m+m-, and
the e+e-® e+e-t+t- processes.
In all cases, the luminosity of the Monte Carlo events is more than five times
that of the data.
The events are selected with the same selection algorithm used for the single
photon candidates.
A summary of the production for the single electron studies is shown in
Table 7.1 with the specific selection requirements of the Monte
Carlo four vectors.
| SINGLE ELECTRON MONTE CARLO PRODUCTION |
|
Acceptance - At least one e± with Ee > 0.9 GeV and
|cos(qe±)| < 0.7, |
|
other e-± and photon with |cos(qg)| > 0.7. |
| RUN | PROCESS | GENER. | ECM | EVTS.
| L (pb-1) |
| 1301 | e+e- ® e+e-g | TEEGG | 91.25
| 4572 | 3.10±0.03 |
|
Acceptance - At least one e± with Ee > 2.0 GeV |
|
and 0.75 < |cos(qe±)| < 0.95, other e± and photon with
|cos(qg)| > 0.95. |
| RUN | PROCESS | GENER. | ECM | EVTS.
| L (pb-1) |
| 1304 | e+e- ® e+e-g | TEEGG | 91.25
| 3000 | 2.20±0.04 |
|
Acceptance - At least one e± with Ee > 2.0 GeV and
|cos(qe±)| < 0.75, |
|
and the other e± and photon with |cos(qg)| > 0.90. |
| RUN | PROCESS | GENER. | ECM | EVTS.
| L (pb-1) |
| 1305 | e+e- ® e+e-g | TEEGG | 91.25
| 20000 | 10.18±0.13 |
|
Acceptance - At least one e± with Ee > 2.0 GeV and
|cos(qe±)| < 0.75, |
|
and no other particles with Ee > 0.9 GeV and |cosq| > 0.90, |
|
and qsep > 200 mrad. |
| RUN | PROCESS | GENER. | ECM | EVTS.
| L (pb-1) |
| 1710 | e+e- ® e+e-e+e- | VERMAS
| 91.25 | 16929 | 10.01±0.08 |
| 1712 | e+e- ® e+e-m+m- | VERMAS
| 91.25 | 10091 | 10.01±0.10 |
| 1714 | e+e- ® e+e-t+t- | VERMAS
| 91.25 | 653 | 10.10±0.39 |
|
Acceptance - At least one e± with Ee > 0.9 GeV and
ptot > 2.0 GeV |
|
and 0.75 < |cos(qe±)| < 0.92 |
| RUN | PROCESS | GENER. | ECM | EVTS.
| L (pb-1) |
| 1711 | e+e- ® e+e-e+e- | VERMAS
| 91.25 | 8143 | 10.01±0.11 |
| 1713 | e+e- ® e+e-m+m- | VERMAS
| 91.25 | 5617 | 10.01±0.13 |
| 1715 | e+e- ® e+e-t+t- | VERMAS
| 91.25 | 845 | 10.10±0.34 |
Table 7.1: Monte Carlo Production for Single Photon Studies.
Using the above selection criteria, a sample of 14,946 single electron events
have been selected in EB and a sample of 5441 single electron events in EE
from the 1991 data.
The agreement between the selected single electron events and Monte Carlo
simulation from e+e-® e+e-g, e+e-® e+e-e+e-, e+e-® e+e-m+m-, and e+e-® e+e-t+t- is excellent as shown in
Figure 7.3 for the barrel and endcap regions.
The corrections applied to the single electron selection include trigger
inefficiencies (0.06±0.02%), track inefficiencies (0.2±0.2%),
energy and dE/dx cut (-0.5±0.5%), and 2nd cluster veto
(0.7±0.7%).
The total number of single electron Monte Carlo events selected in EB is
14,672.9, while the total number of single electron Monte Carlo events selected
in EE is 5488.4.
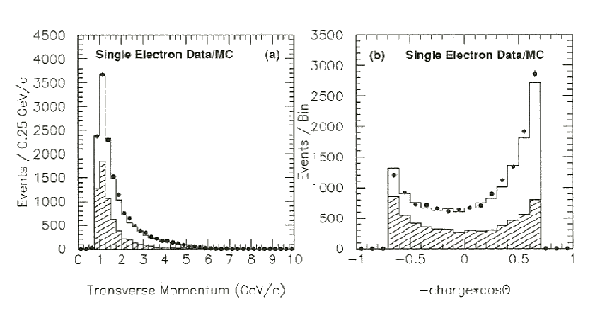
Figure 7.3: Single Electron Spectra in the Barrel
The transverse momentum spectrum (a) and the angular distribution (b) of
the single electron events is shown.
The combined data with statistical errors is shown by the solid dots, while
the shaded histogram show the contribution from the reactions e+e-® e+e-e+e-, e+e-® e+e-m+m-,
and e+e-® e+e-t+t-, and the unshaded area shows the expectation from e+e-® e+e-g normalized
to the integrated luminosity of 12.167±0.083 pb-1.
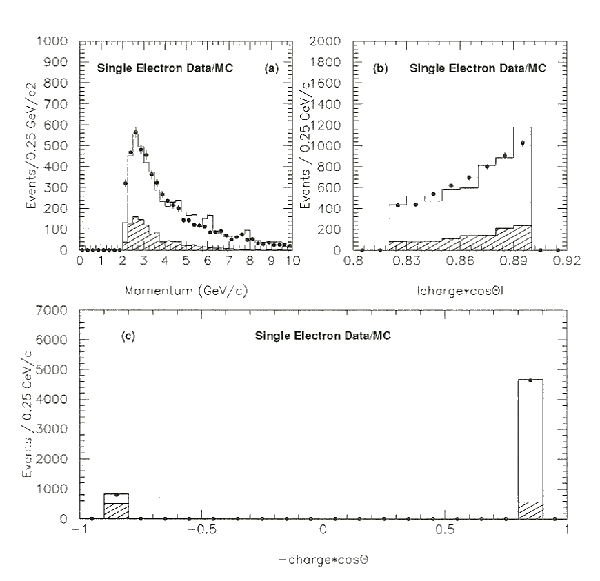
Figure 7.4: Single Electron Spectra in the Endcap
The transverse momentum spectrum (a) and the angular distribution (b) and
(c) of the single electron events is shown.
The combined data with statistical errors is shown by the solid dots, while
the shaded histogram show the contribution from the reactions e+e-® e+e-e+e-, e+e-® e+e-m+m-,
and e+e-® e+e-t+t-, and the unshaded area shows the expectation from e+e-® e+e-g normalized
to the integrated luminosity of 12.167±0.083 pb-1.
7.3 Single Electron Energy Loss and Resolution
The energy loss for the single electrons is equivalently defined as the
difference between the central detector momentum and the calorimeter energy
of the electron.
The single electron events are ideal since the momentum is well measured from
the curvature of the track in the central detector and can be compared
directly to the electromagnetic calorimeter shower.
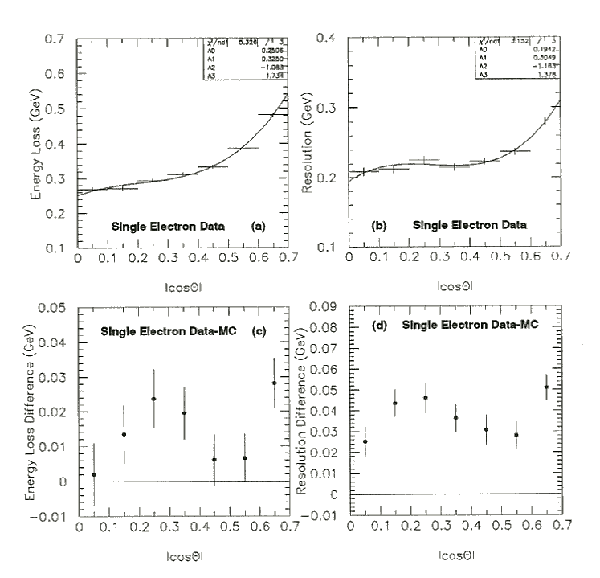
Figure 7.5(a) and (b) shows the energy loss and resolution of
the single electron data set as a function of angle with p < 5.0 GeV/c.
In Figure 7.5(c) and (d) is the difference in the energy loss and
resolution between the data and Monte Carlo for the single electrons as a
function of polar angle with p < 5.0 GeV/c.
From the agreement between the calorimeter energy loss and resolution in the
coil, the data seem to be well simulated.
Figure 7.5: Single Electron Energy Loss and Resolution
The energy loss is defined as the difference in the electron momentum
measured by the central detector and by the electron energy from the
electromagnetic calorimeter.
The energy loss is shown by the solid dots with statistical errors in (a)
along with the energy resolution in (b) over photon polar angle with
p < 5.0 GeV/c.
The difference in the energy loss between the single electron data and Monte
Carlo is shown in (c) along with the corresponding difference for the
resolution shown in (d).
For the single electron events considered in EB, the average energy loss of
the electrons due to the coil is 0.360 GeV with an average discrepancy of
0.010 GeV more than the energy loss of the Monte Carlo.
The energy resolution is typically 0.250 GeV which is about 0.025 GeV more
than that of the Monte Carlo.
For the single electron events considered in EE, the average energy loss of
the electrons due to the coil is 0.740 GeV with an average discrepancy of
0.123 GeV more than the energy loss of the Monte Carlo.
The energy resolution is typically 0.315 GeV which is about 0.114 GeV more
than that of the Monte Carlo.
Specifically for single electron energies of 1.30 GeV in the barrel, the data
and Monte Carlo simulation agree to within 0.025 GeV for the energy loss and
0.028 GeV for the resolution of the energy loss.
With the simulation of the single photon events in the barrel similar to the
simulation of the single electron events, the uncertainty in the energy scale
for photons with Egcorrnear 1.50 GeV would correspond to the uncertainty
in the energy scale for the single electron events with Egnear 1.30 GeV.
The corresponding uncertainty in the energy scale for the single photon events
is 0.025 GeV with a resolution of 0.028 GeV.
The systematic error associated with this uncertainty is determined by varying
the cut on Egcorr by this amount, selecting single photon candidates and
determining the number of neutrinos based upon the selected events (refer
to Chapter 10).
From such considerations, the systematic error introduced by the energy scale
is determined to be 3.12% as shown in Table 10.2.